YU Cob CuS
The Yamaguchi University Competency-Based Curricular System (YU CoB CuS)
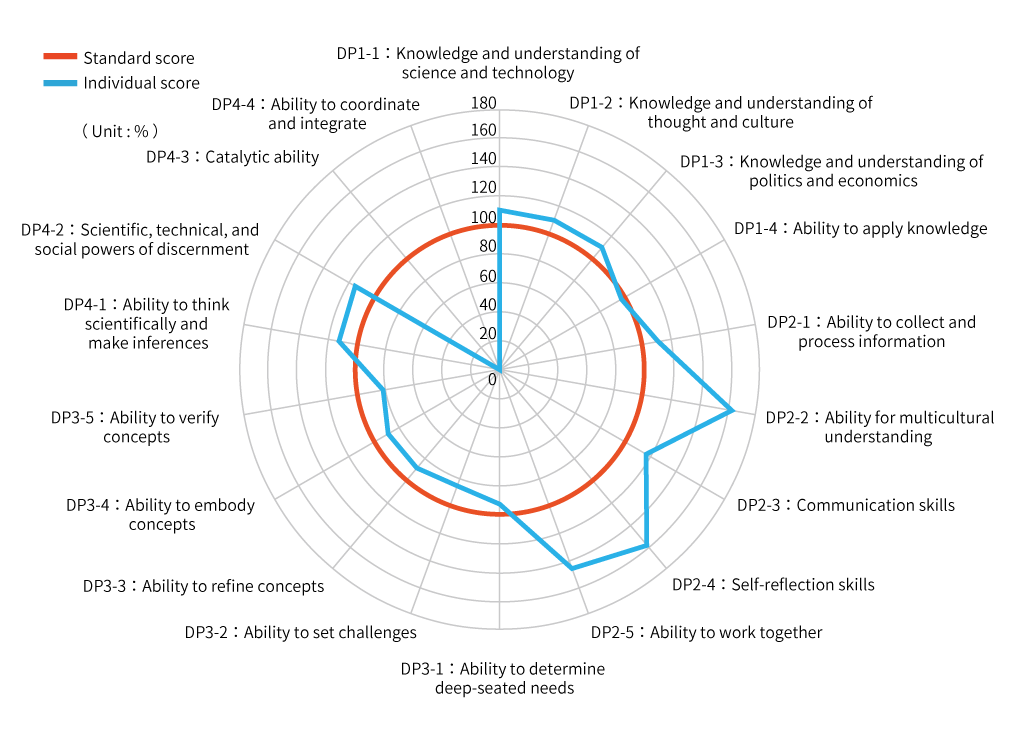
The YU CoB CuS is a system that is based on the competencies that students should acquire by the time they graduate from the faculty, which have been set as diploma policies (DP) and quantitatively show the degree to which students have acquired said competencies. Using this system clarifies the positioning of the DPs and courses, and makes it possible to visualize the acquired competencies. It also allows the students to independently design their own learning plans by checking to confirm their own level of achievement.
The foundation of the YU CoB CuS is a matrix that consists of courses laid out on the horizontal axis (rows) and the DPs on the vertical axis (columns). More specifically, the standard score for the individual courses versus each DP are totaled along the columns, with this serving as the standard score for the DP.
Individual scores are calculated in accordance with a student’s grades when they earn credit for a course. More specifically, scores are calculated by multiplying the standard score by 1.4 if the student is rated as “Superlative,” by 1.2 if the student is “Excellent,” by 1.0 for “Good,” and by 0.8 for “Capable.” The total scores for each DP are calculated, then the individual scores for the DPs are calculated (see the figure below).
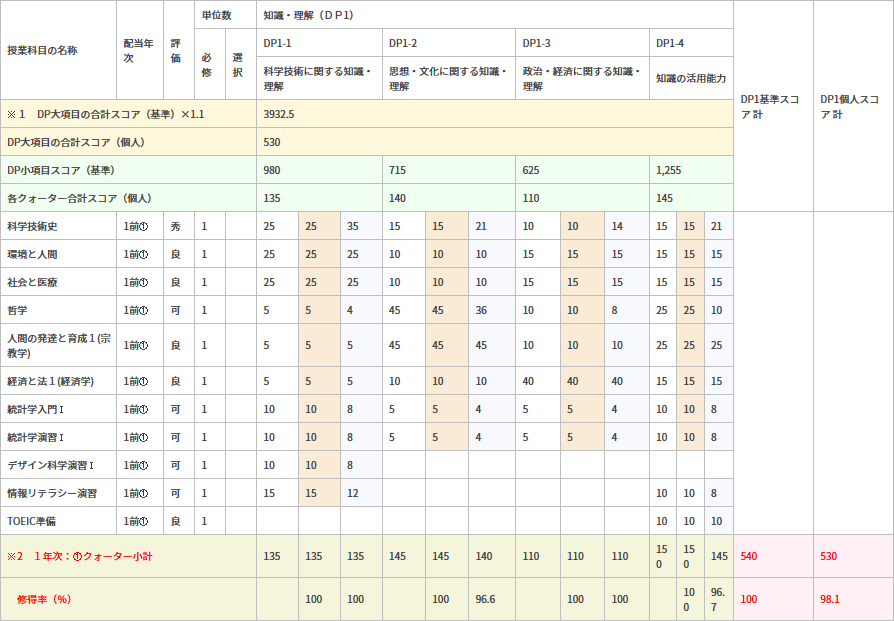
| Class Name | Year Allotted | Rating | No. of Credits | Knowledge and Understanding(DP1) | DP1 Standard Score Total | DP1 Individual Score Total | ||||||||||||
| Required | Elective | DP1-1 | DP1-2 | DP1-3 | DP1-4 | |||||||||||||
| Knowledge and understanding of science and technology | Knowledge and understanding of thought and culture | Knowledge and understanding of politics and economics | Ability to apply knowledge | |||||||||||||||
| *1 Total score for DP large categories (standard) × 1.1 | 3932.5 | |||||||||||||||||
| Total score for DP large categories (individual) | 530 | |||||||||||||||||
| DP subcategory score (standard) | 980 | 715 | 625 | 1,255 | ||||||||||||||
| Total scores for each quarter (individual) | 135 | 140 | 110 | 145 | ||||||||||||||
| History of Science and Technology | 1st quarter(1) | Superior | 1 | 25 | 25 | 35 | 15 | 15 | 21 | 10 | 10 | 14 | 15 | 15 | 21 | |||
| Humans and Environment | 1st quarter(1) | Good | 1 | 25 | 25 | 25 | 10 | 10 | 10 | 15 | 15 | 15 | 15 | 15 | 15 | |||
| Society and Medical Service | 1st quarter(1) | Good | 1 | 25 | 25 | 25 | 10 | 10 | 10 | 15 | 15 | 15 | 15 | 15 | 15 | |||
| Philosophy | 1st quarter(1) | Capable | 1 | 5 | 5 | 4 | 45 | 45 | 36 | 10 | 10 | 8 | 25 | 25 | 10 | |||
| Human Development I(Religious Studies) | 1st quarter(1) | Good | 1 | 5 | 5 | 5 | 45 | 45 | 45 | 10 | 10 | 10 | 25 | 25 | 25 | |||
| Economics and Law I(Economics) | 1st quarter(1) | Good | 1 | 5 | 5 | 5 | 10 | 10 | 10 | 40 | 40 | 40 | 15 | 15 | 15 | |||
| Introduction to Statistics I | 1st quarter(1) | Capable | 1 | 10 | 10 | 8 | 5 | 5 | 4 | 5 | 5 | 4 | 10 | 10 | 8 | |||
| Practice of Statistics I | 1st quarter(1) | Capable | 1 | 10 | 10 | 8 | 5 | 5 | 4 | 5 | 5 | 4 | 10 | 10 | 8 | |||
| Design Science Seminar I | 1st quarter(1) | Capable | 1 | 10 | 10 | 8 | ||||||||||||
| Information Literacy | 1st quarter(1) | Capable | 1 | 15 | 15 | 12 | 10 | 10 | 8 | |||||||||
| Comprehensive Preparation for the TOEIC Test | 1st quarter(1) | Good | 1 | 10 | 10 | 10 | ||||||||||||
| *2 First Year: (1) quarter subtotal | 135 | 135 | 135 | 145 | 145 | 140 | 110 | 110 | 110 | 150 | 150 | 145 | 540 | 530 | ||||
| Rate of Mastery (%) | 100 | 100 | 100 | 96.6 | 100 | 100 | 100 | 96.7 | 100 | 98.1 | ||||||||
For example, a student that fulfilled the graduation credits with ratings of “Good” for everything would have an individual score that is consistent with the standard score. The individual scores are calculated for each quarter, and are then visualized through the use of tools like a radar chart. Doing so makes it possible to confirm at a glance the degree to which a student has fulfilled each DP (what DPs they are behind on), which makes it easy for them to set up their learning plan for the next quarter.